Stratoflights Project 2019
With the Raspberry Pi into the Stratosphere
Over the project
This project was mainly a project of the Physics course from the Robert-Havemann-Gymnasium in Berlin-Karow. They wanted to start a ballon into stratosphere. The pupil had to develop the design of the sonde including the technology. After
the design the ballon should start into the Stratosphere and the collected data should be used to train the usage of data in calculations on the computer.
They want to collect data about the alpha radiation, temperature, air pressure and UV radiation. Further should cameras take some photos, to see the school decrease and show a view in the stratosphere.
The Project was a chellenge for this class. The technical development of the project was difficult.
At this point the teacher makes the decision to transfer the technical part of the project into an particular project for my university. Me and three other students choose this project for our seminar. From the teacher we got the hardware
and some first developments of the pupil. This means we get some Raspberry Pi, some Arduino and sensors.
We programmed code for the Arduinos to take the measures of the sensors. We just want to have only one Arduino board in use, so we put all code together into one. The Raspberry Pi was used to recive and store the data from the Arduino. In a
parallel job we make photos and stored them on the card. On the system we installed a kill-switch to safely shutdown it after the flight.
The pretest - Ice test
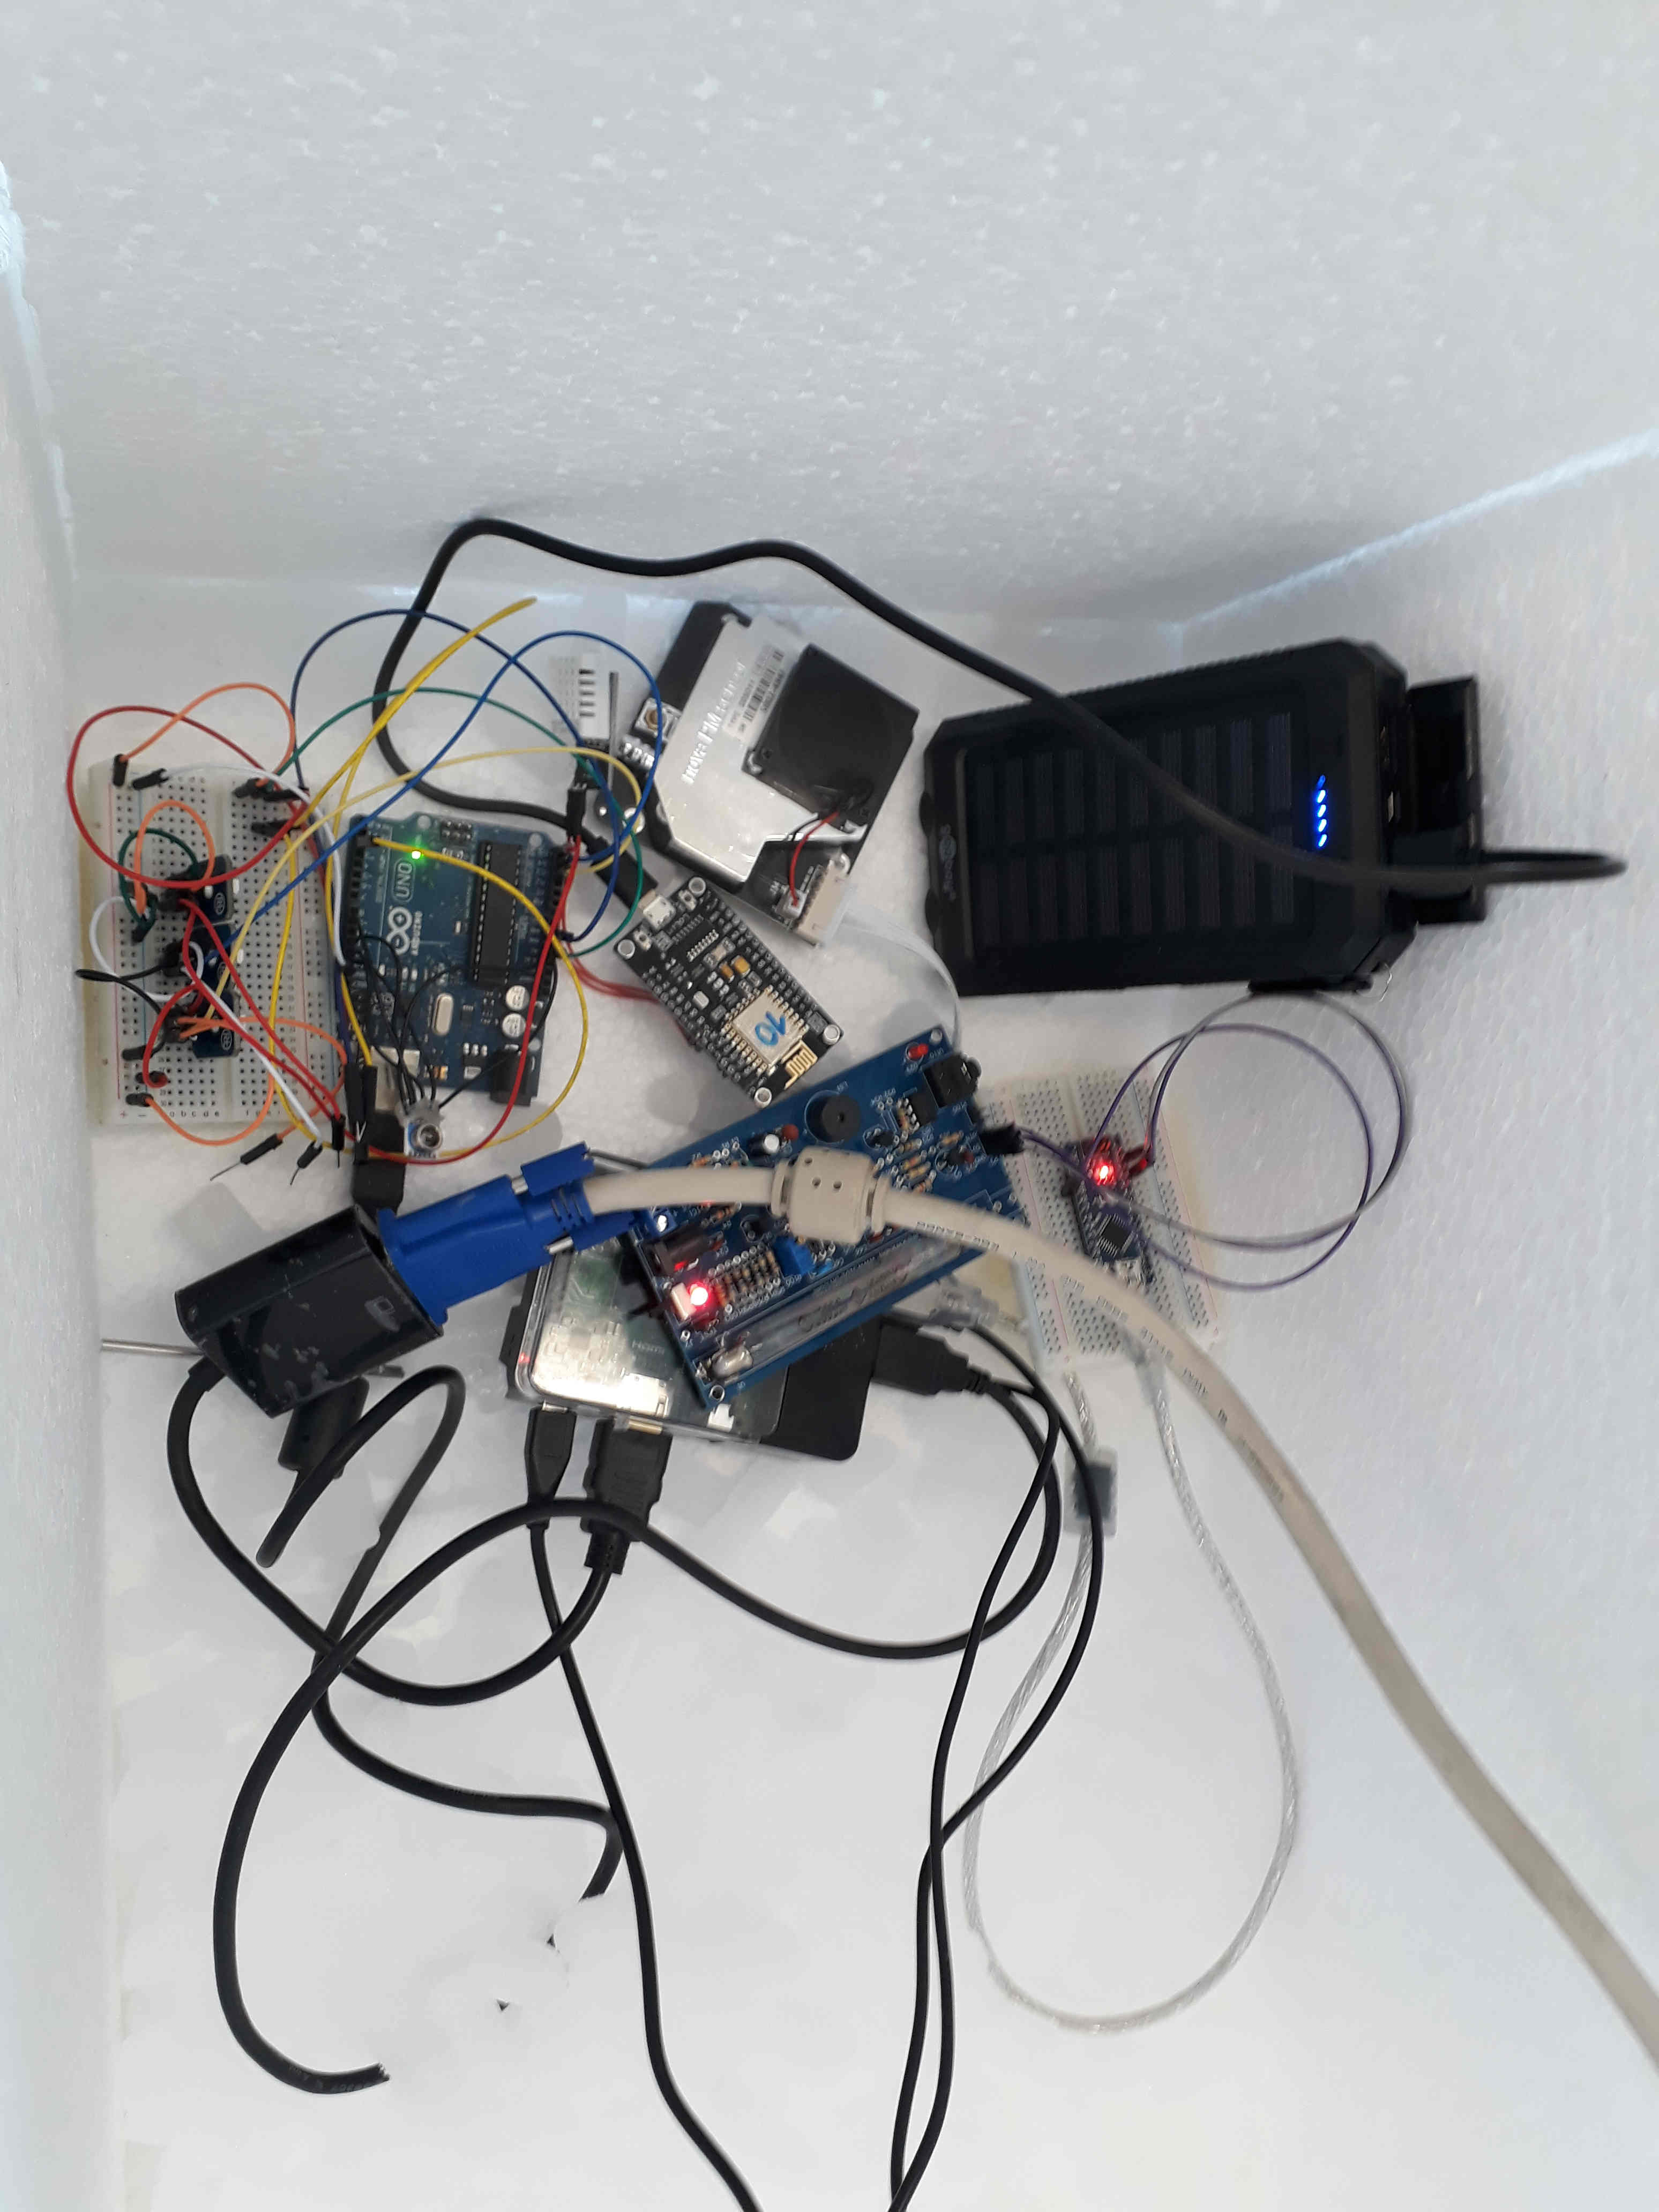
On the way to the stratosphere the air get first cooler and later a bit warmer. Of corse the teacher knows that. Therefore we tested the sensors to be stable in a cool environment with a box and dry ice. We put all sensors for a prototype together, as we planned it before. Then we put the Arduinos with the sensors and connected to the Raspberry Pi on ice. To see everything is working we connected a screen, mouse and a keyboard to it. Until -63°C were no problems seen. All sensors worked as on room temprature. Our temprature sensor confirmed the value of the temprature meter from the labratory. Because of this we thought every sensors will work fine and we stopped the test. But in case for the temprature we got after the flight a surprise, including the teacher.
The day of the start
The ballon was started at 07. July 2019 with the technology setting designed by our team. The start was planned for 10:00 (CEST). But the flight security hold the start a moment.
The exact start was at 10:21 (CEST) from the playground of the school. For better finding the ballon after landing there was a GPS tracker installed, which had an independent power source and can connect to the LTE cellular network and tell
it´s position to server of the manufactor. A GPS logger recorded the route and also the altitude. The ballon got up to 40km and therefore more as expected. The flight duration was about three hours. The ballon landed between Lychen
and Fürstenberg (Havel). This is next to the border of Brandenburg and Mecklenburg-Vorpommern. In the stratosphere the ballon poped as expected. Unfortunately at the moment when the ballon pops the sonde get a hitch from the moment of
free fall to the opening of the parachute and so the electronic componets were crashed together, which also crashed the Raspberry Pi. Anyway are the measured data and also 620 pictures survived.
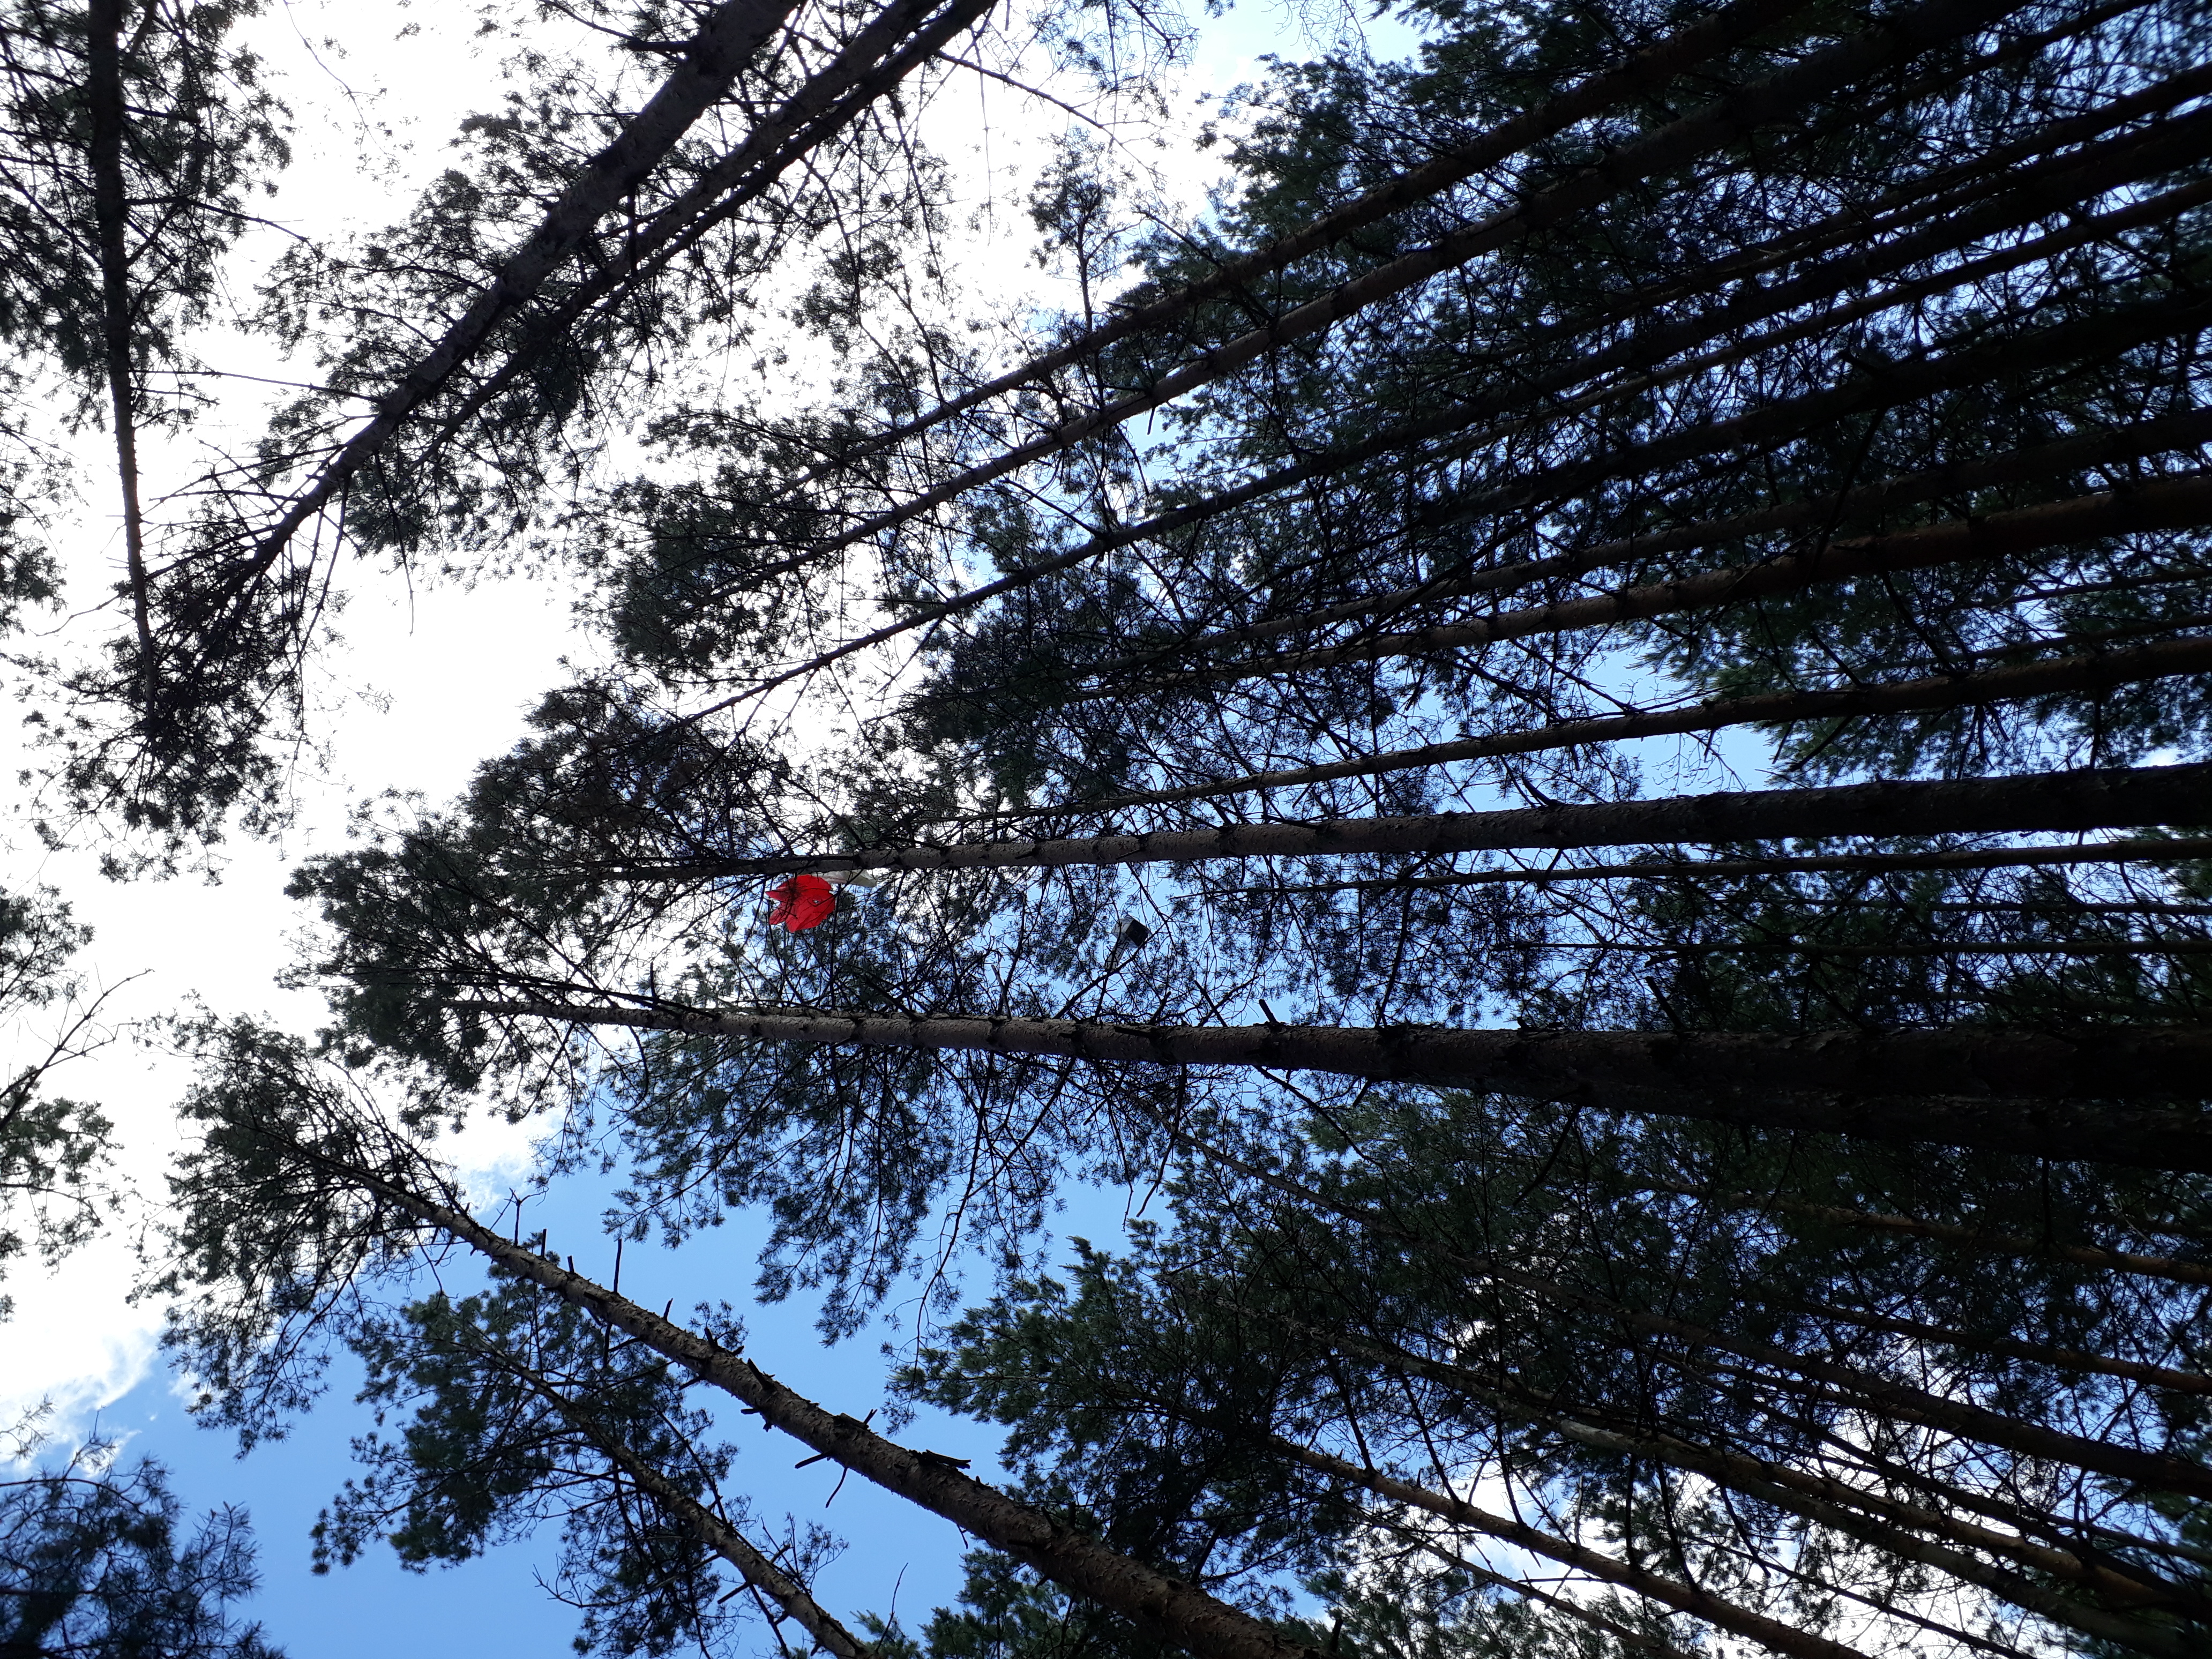
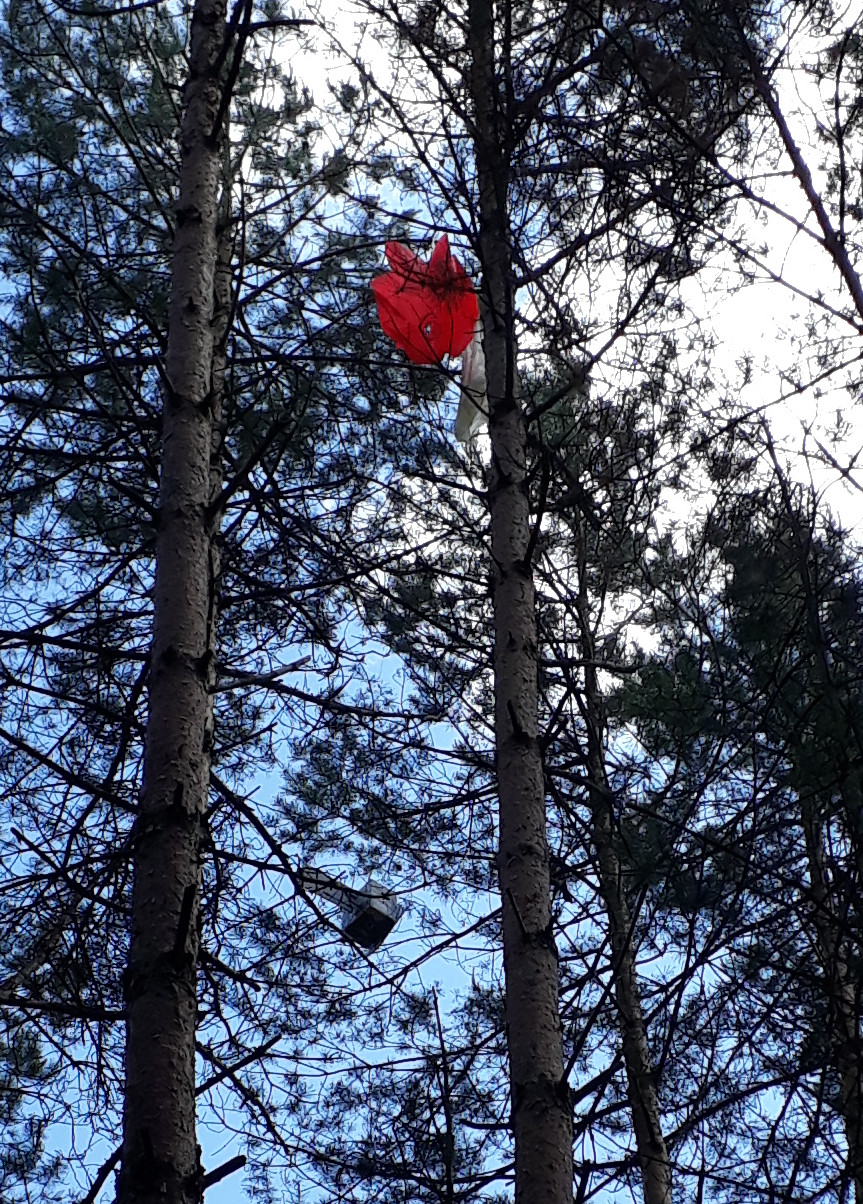
The landing spot
The ballon lands in the near of Lychen in Brandenburg. First it seems that it will go down in a lake. But at this time the ballon was in its final descent. Later the GPS signal had stabilised and as we find it, we saw, that it was landed in a eight meter high tree (see pictures). More pictures see below.
To zoom the graphics touch them
This graphic shows the altitude (measured of the independent GPS-Logger).
Hint: The time is in UTC.
This graphics show the temprature inside the sonde (Pressure.Temp) and outside the sonde (Temprature.Temp) during the flight.
Hint: The time is in CEST. The naming like informatic classes are a result of using diffrent sensors. The air pressure sensor also measured the tempratur inside and a seperate tempreture sensor indicated the values outside.
This graphic shows the air pressure in mbar.
Hint: The flight time is in CEST.
This graphic shows the radioactivity measured with a Geiger-Müller-Counter (average over 100s).
Hint: Displayed is the mean count per altitude meter.
The gaphic shows the changes of UV radiation, described as a voltage in mili volt of the sensor over the flight time.
Hint: The time is in CEST.
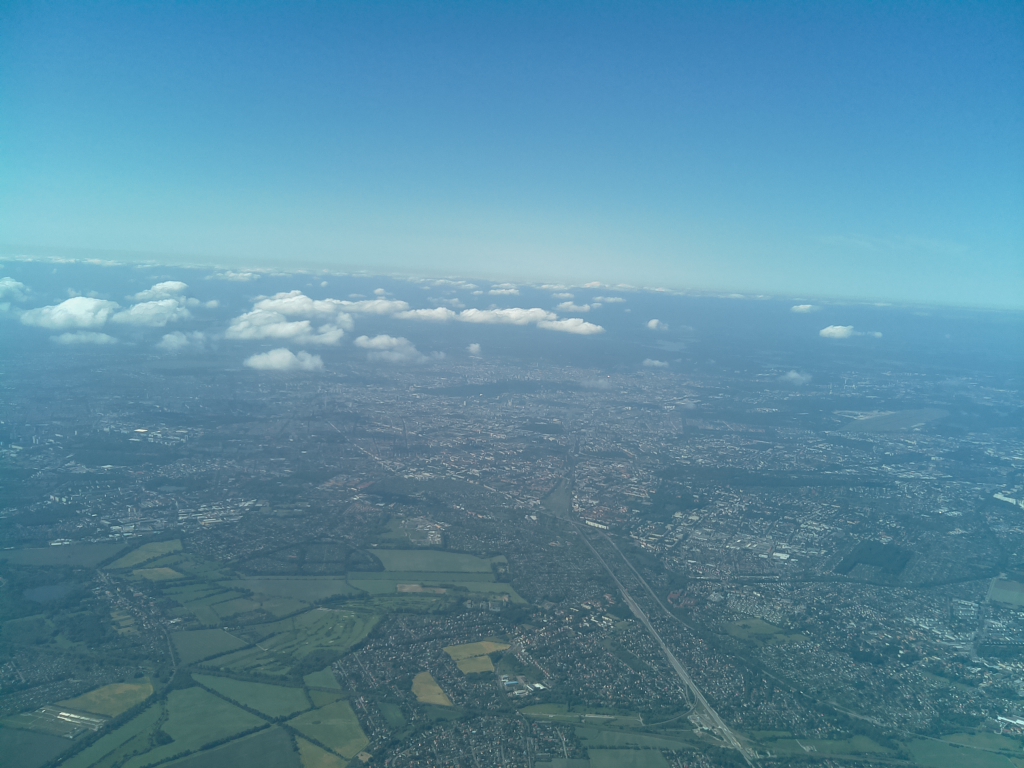
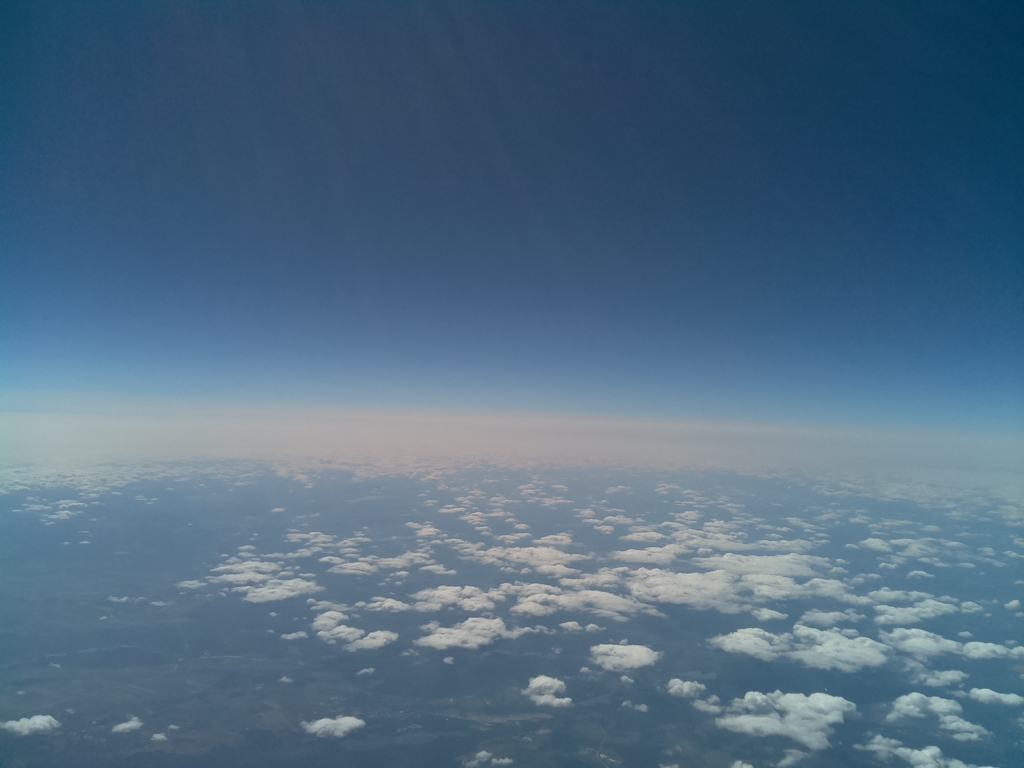
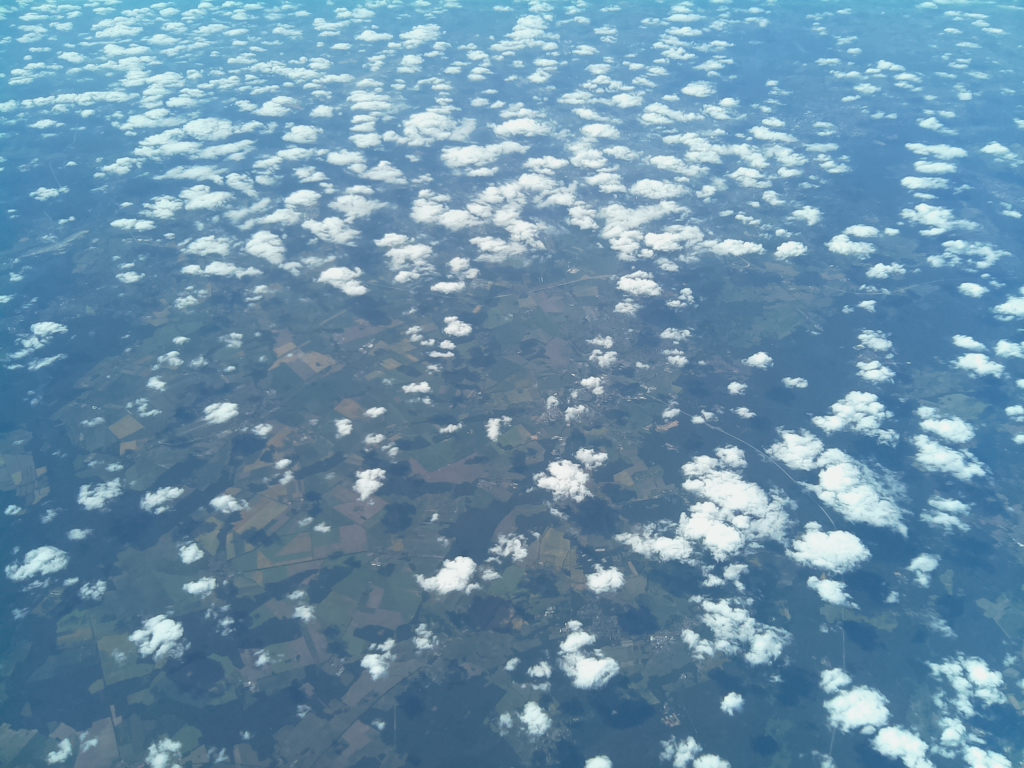
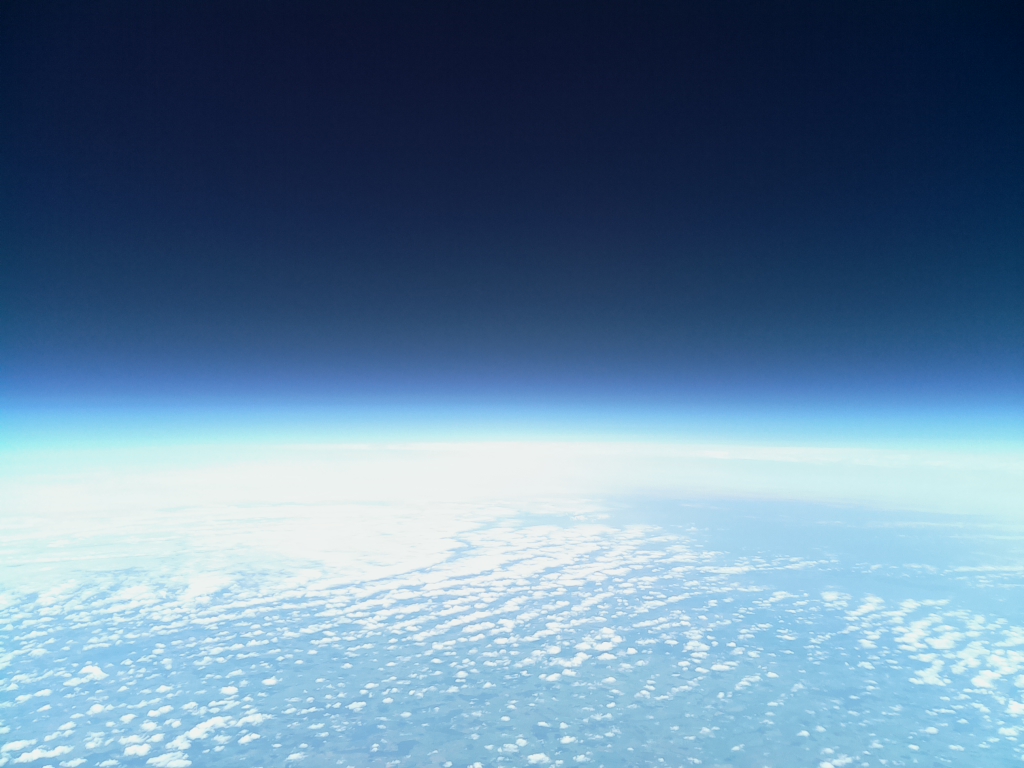
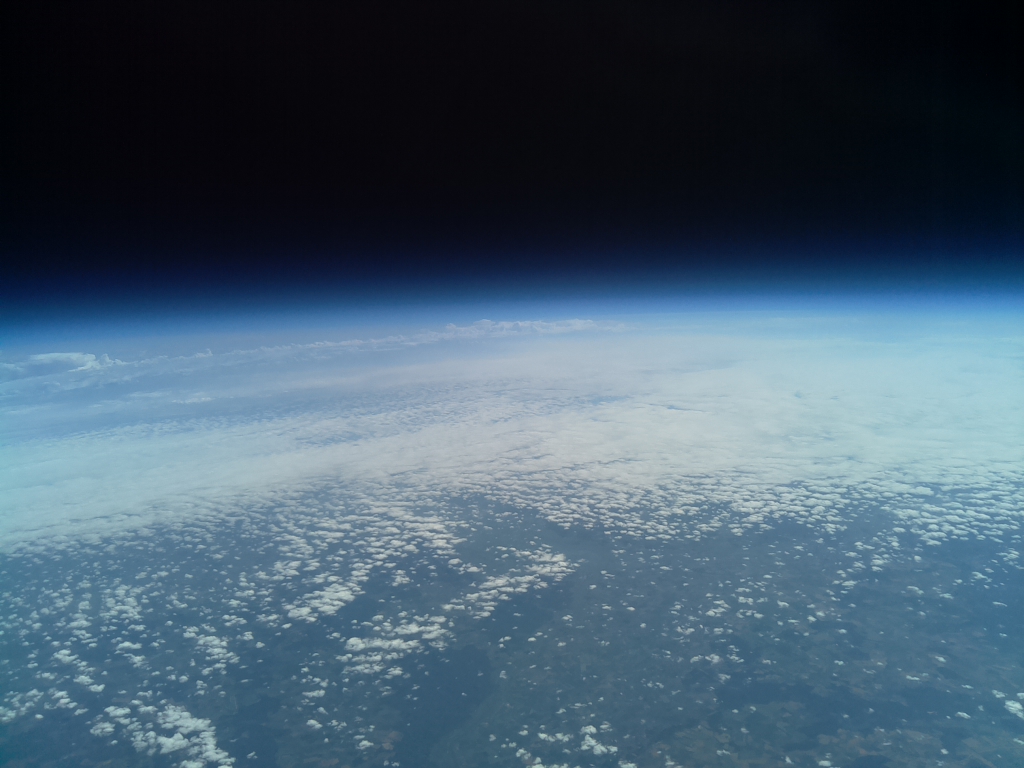
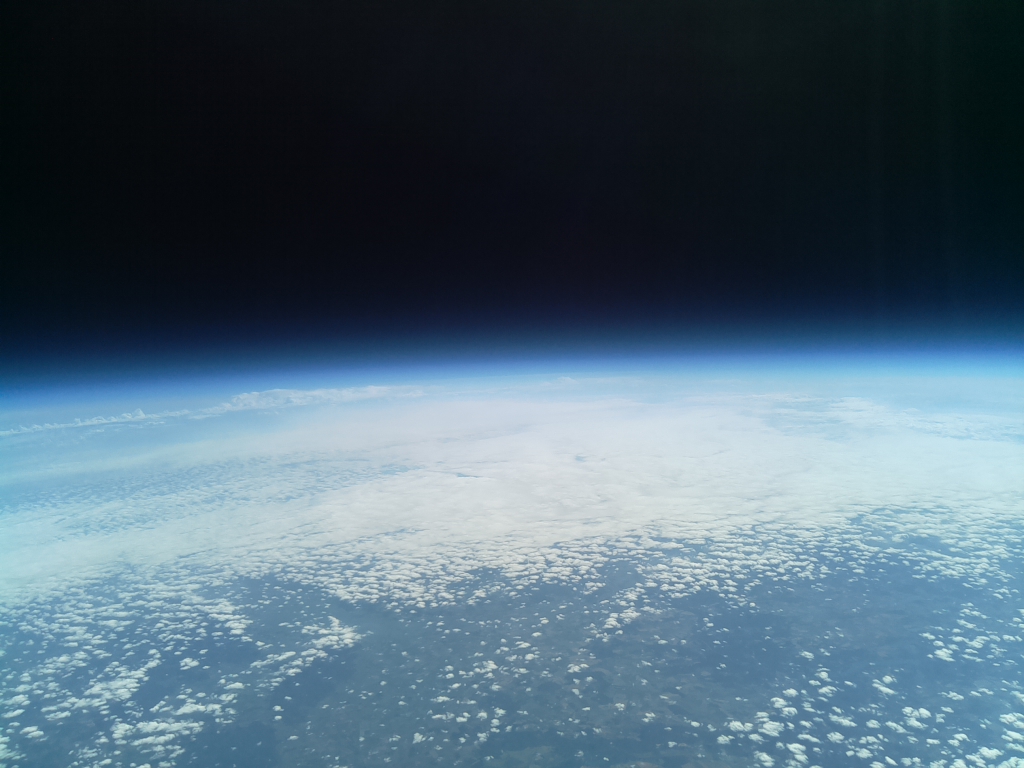
Pictures of the flight
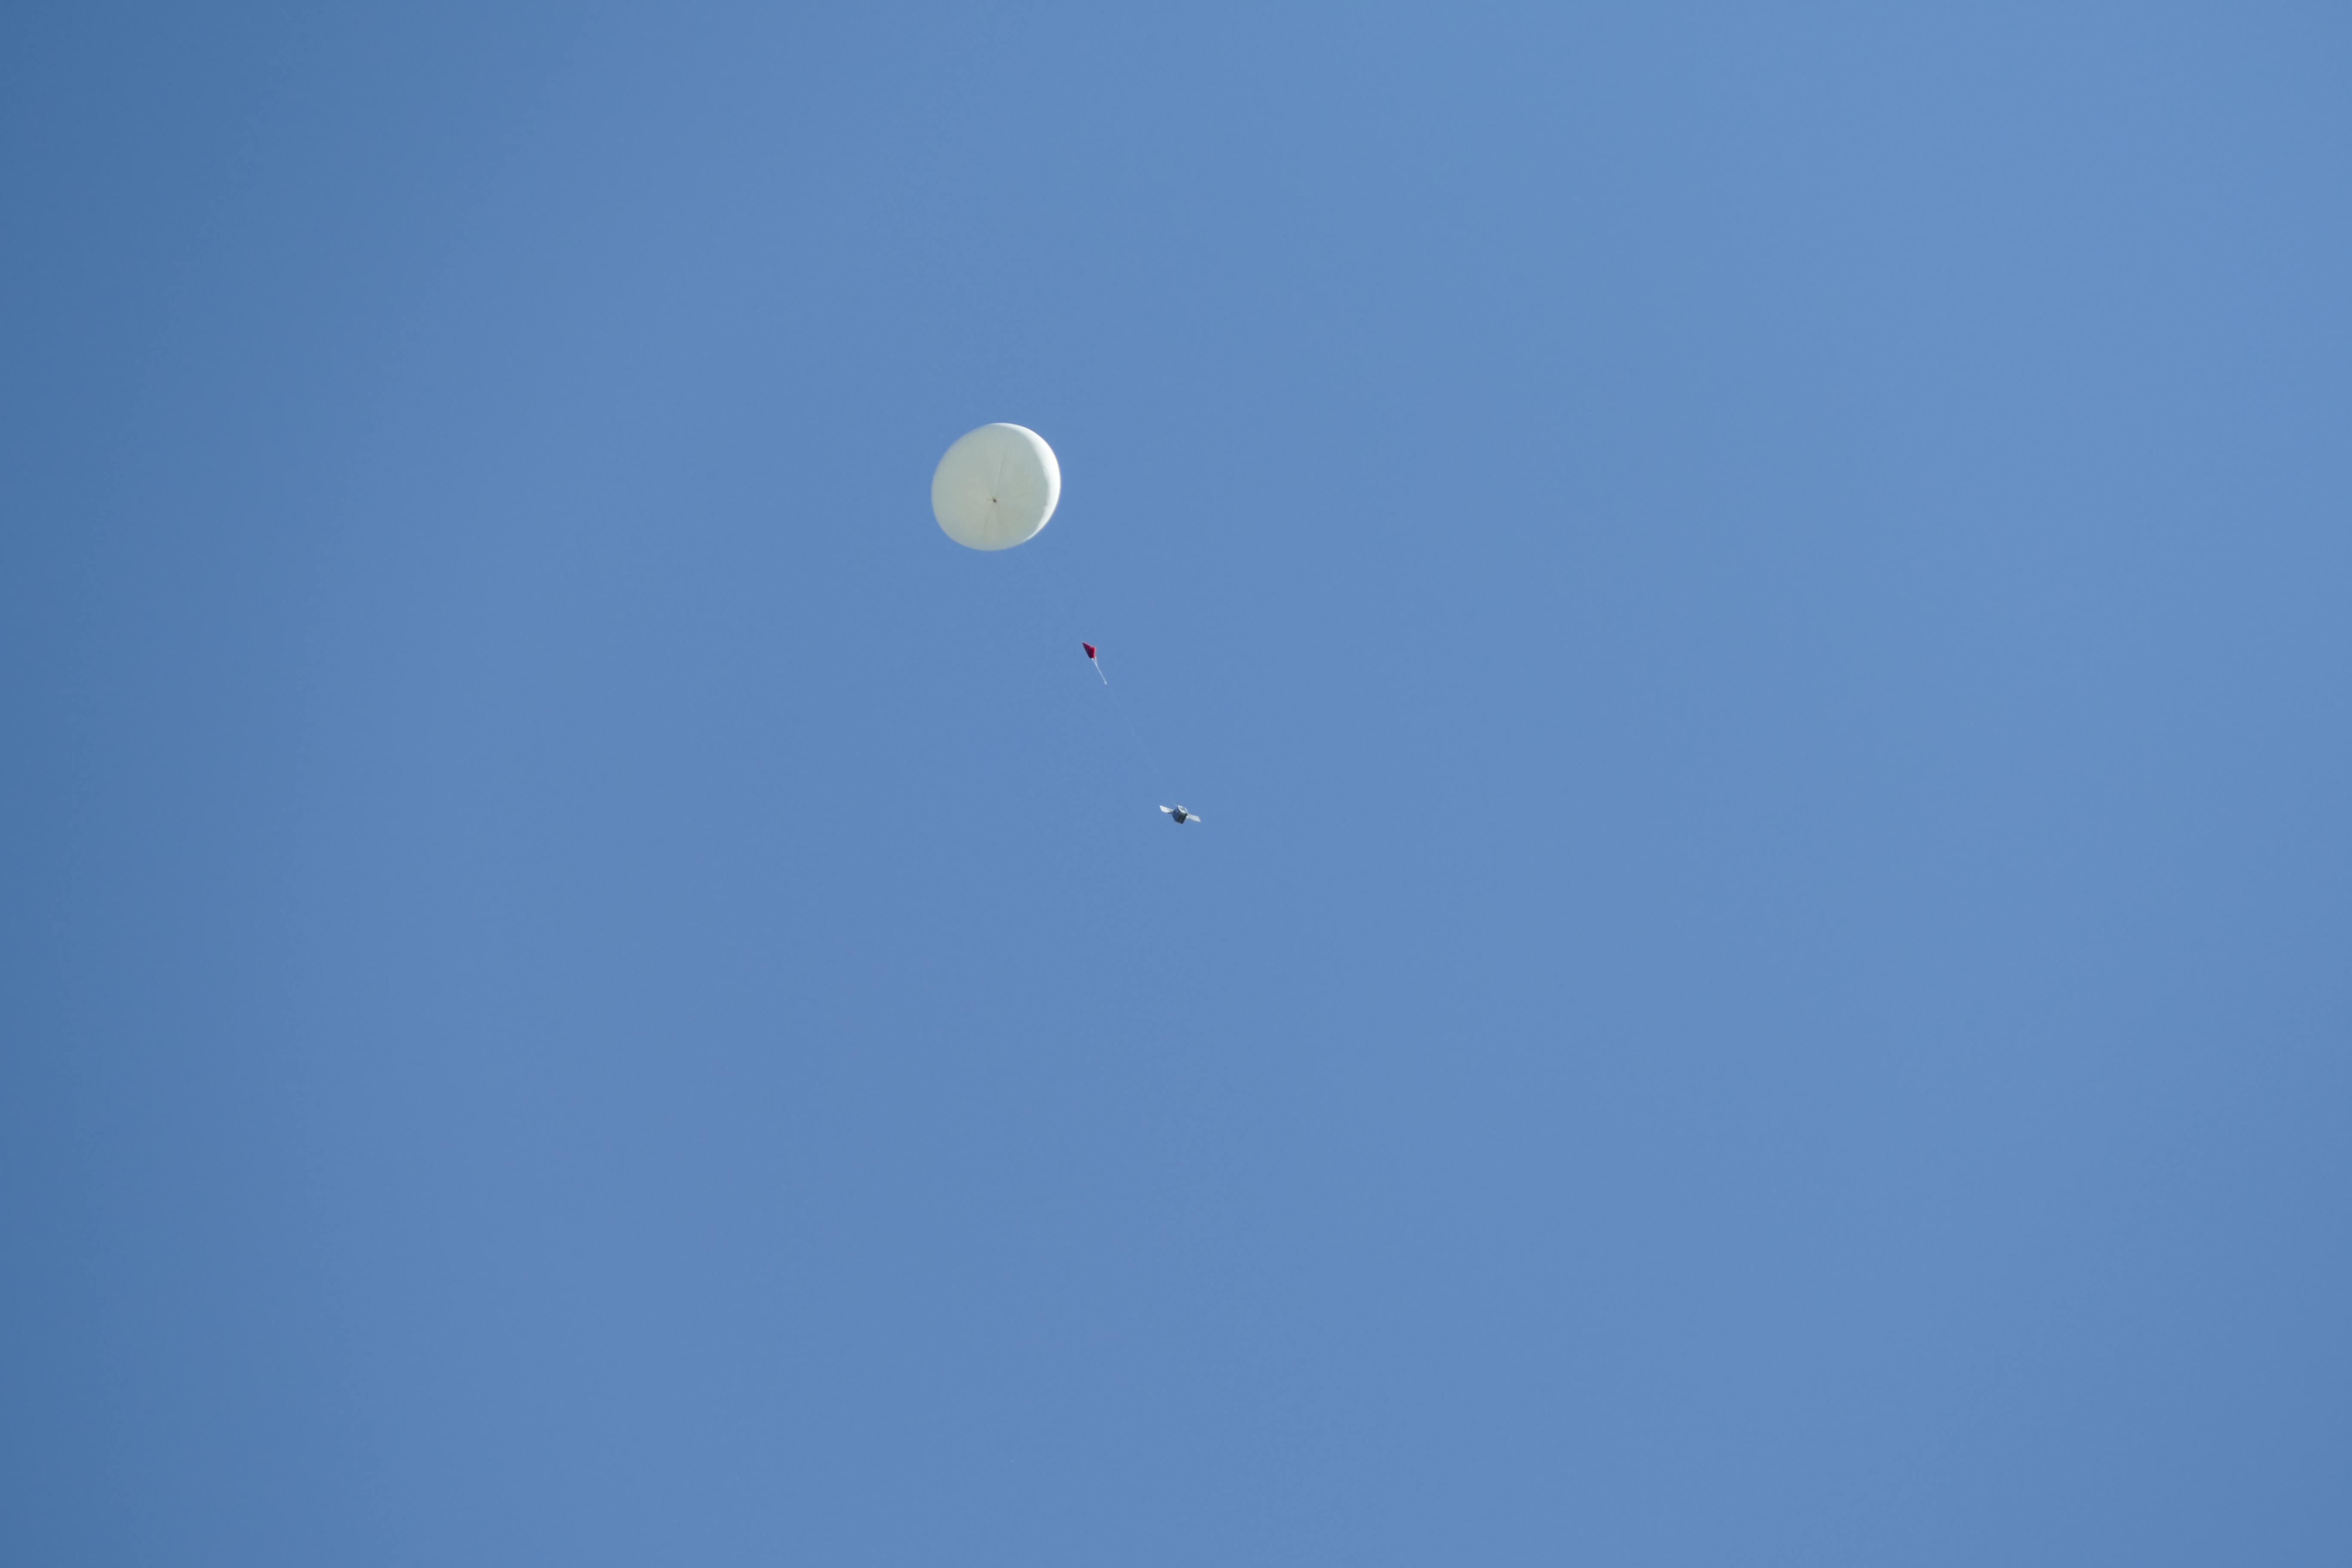
The started ballon from earth..
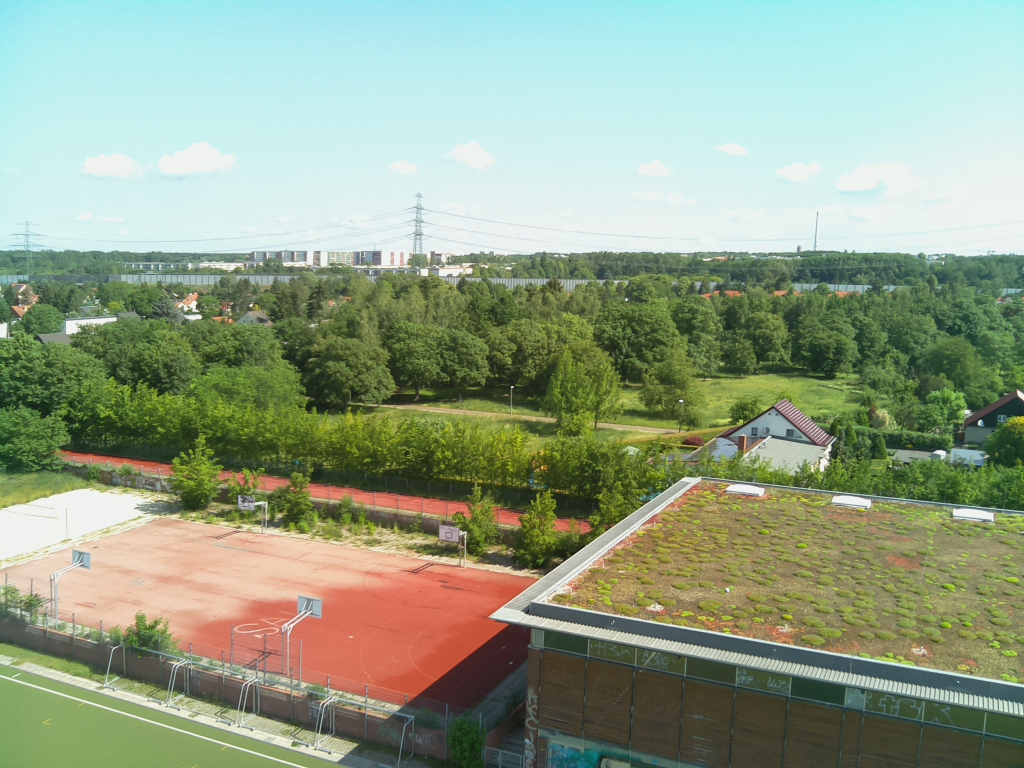
- Flighttime: 10:21:03 (CEST)
- Altitude [m]: 71.6
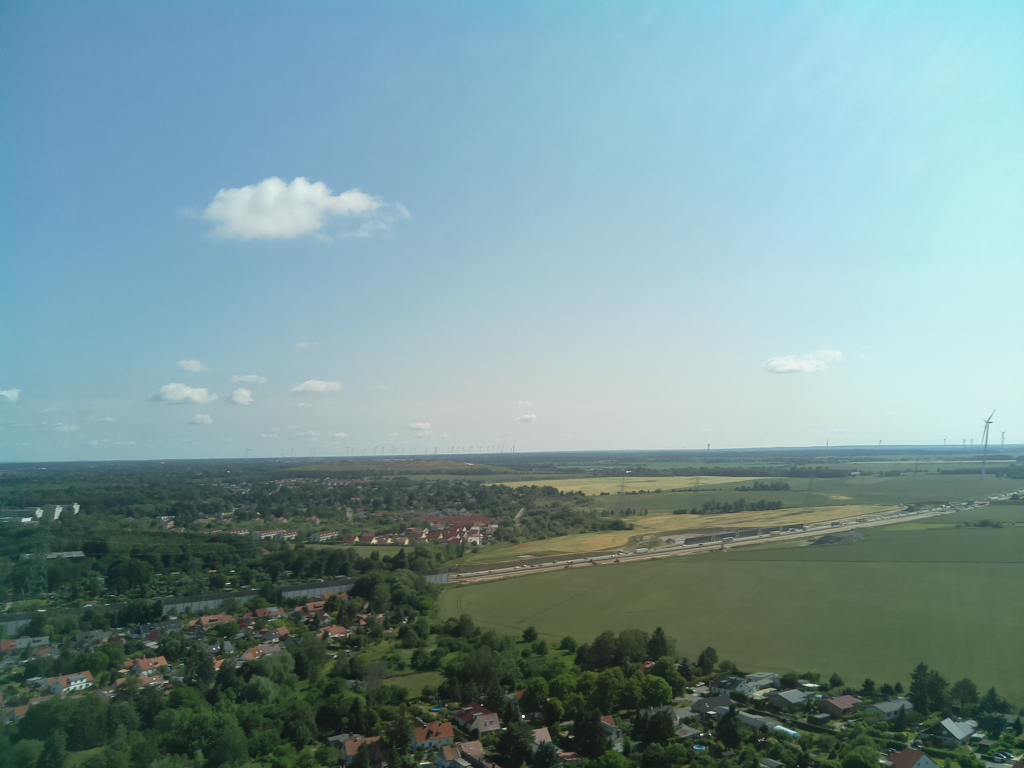
- Flighttime: 10:21:19 (CEST)
- Altitude [m]: 139.3
- Flighttime: 10:22:20 (CEST)
- Altitude [m]: 464.4
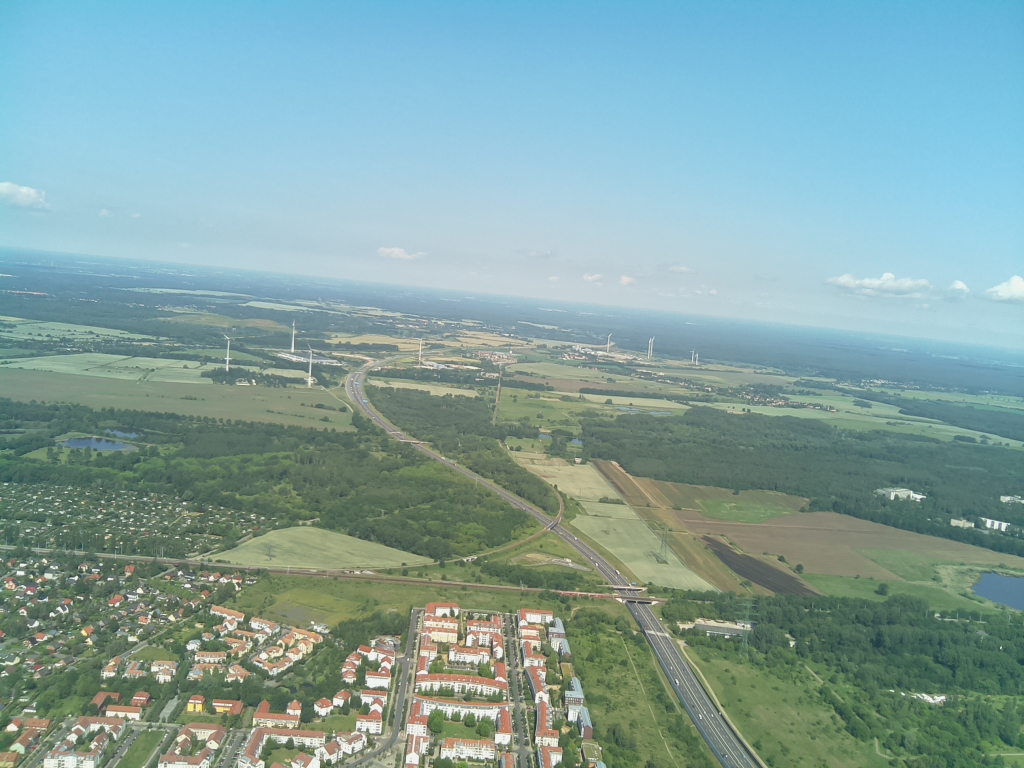
- Flighttime: 10:23:48 (CEST)
- Altitude [m]: 804.6
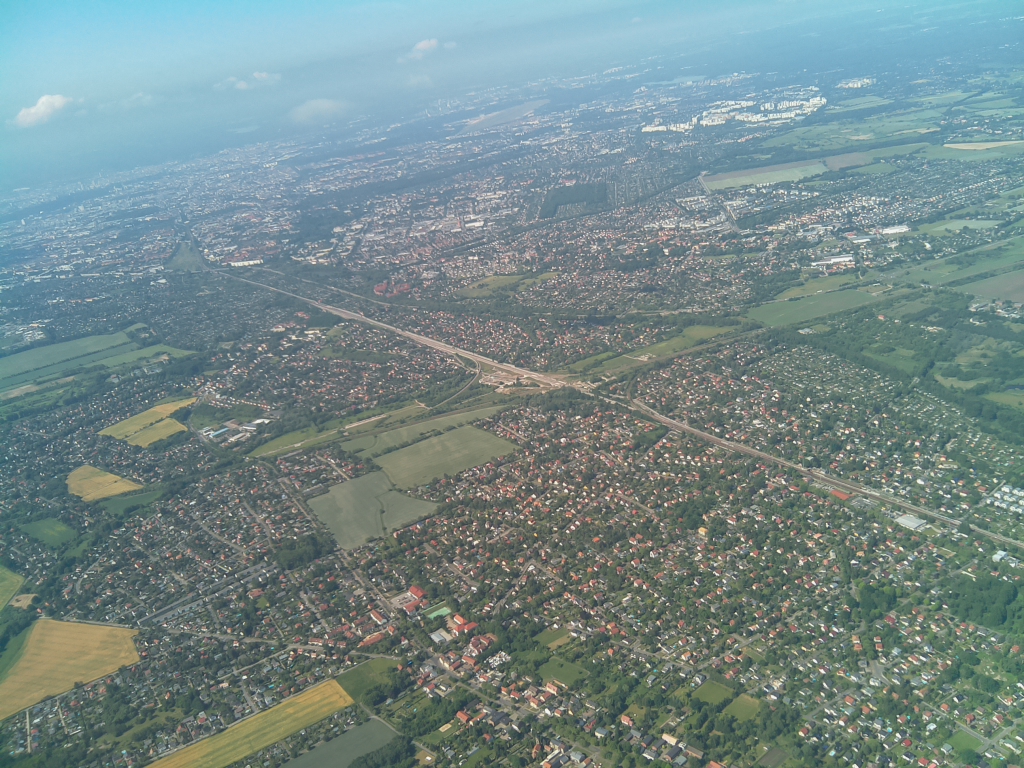
- Flighttime: 10:24:54 (CEST)
- Altitude [m]: 1109.2
- Flighttime: 10:28:24 (CEST)
- Altitude [m]: 1109.2
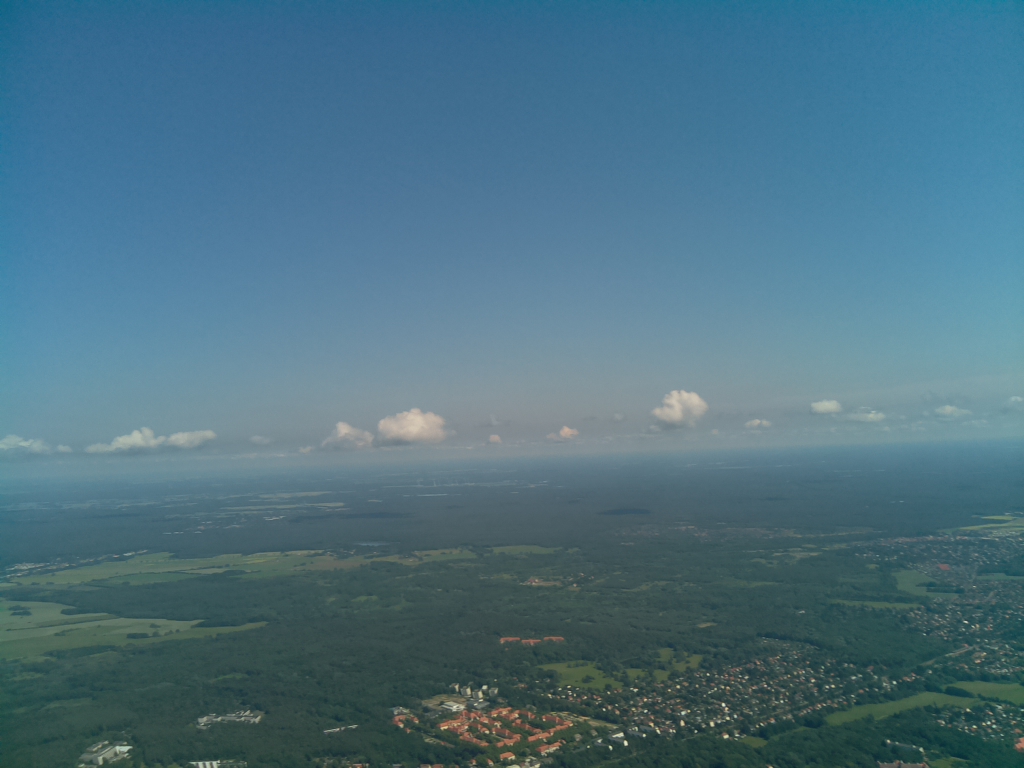
- Flighttime: 10:49:42 (CEST)
- Altitude [m]: 8648.7
- Flighttime: 11:28:42 (CEST)
- Altitude [m]: 20113.6
- Flighttime: 11:29:43 (CEST)
- Altitude [m]: 20413.2
- Flighttime: 12:14:01 (CEST)
- Altitude [m]: 35673.6
- Flighttime: 12:27:16 (CEST)
- Altitude [m]: 40090.4
- The really last picture